vol. 02 · tier 02 // ch. 06 of 10 · intermediate course
Advanced Indicators
The basics (RSI, MACD, EMAs) are well-known, hence less edge. These tools are heavier, more nuanced, and used by more sophisticated traders.
- read
- ~4 min
- length
- 1,041 words
- position
- 06 of 10
6. Advanced Indicators
The basics (RSI, MACD, EMAs) are well-known, hence less edge. These tools are heavier, more nuanced, and used by more sophisticated traders.
Ichimoku Kinko Hyo (“one-glance equilibrium chart”)
A complete trend system in a single overlay. Five components:
| Line | Calc | Meaning |
|---|---|---|
| Tenkan-sen (Conversion) | (9-high + 9-low) / 2 | Short-term momentum |
| Kijun-sen (Base) | (26-high + 26-low) / 2 | Medium-term trend |
| Senkou Span A | (Tenkan + Kijun) / 2, shifted +26 | Cloud edge 1 |
| Senkou Span B | (52-high + 52-low) / 2, shifted +26 | Cloud edge 2 |
| Chikou Span | Close, shifted −26 | Confirmation lag |
The area between Span A and B = the Kumo (cloud).
Reading it
- Price above cloud = bullish regime.
- Price below cloud = bearish.
- Cloud thickness = strength of S/R.
- Tenkan crosses Kijun above cloud = strong long signal.
- Chikou span above price 26 bars ago = trend confirmed.
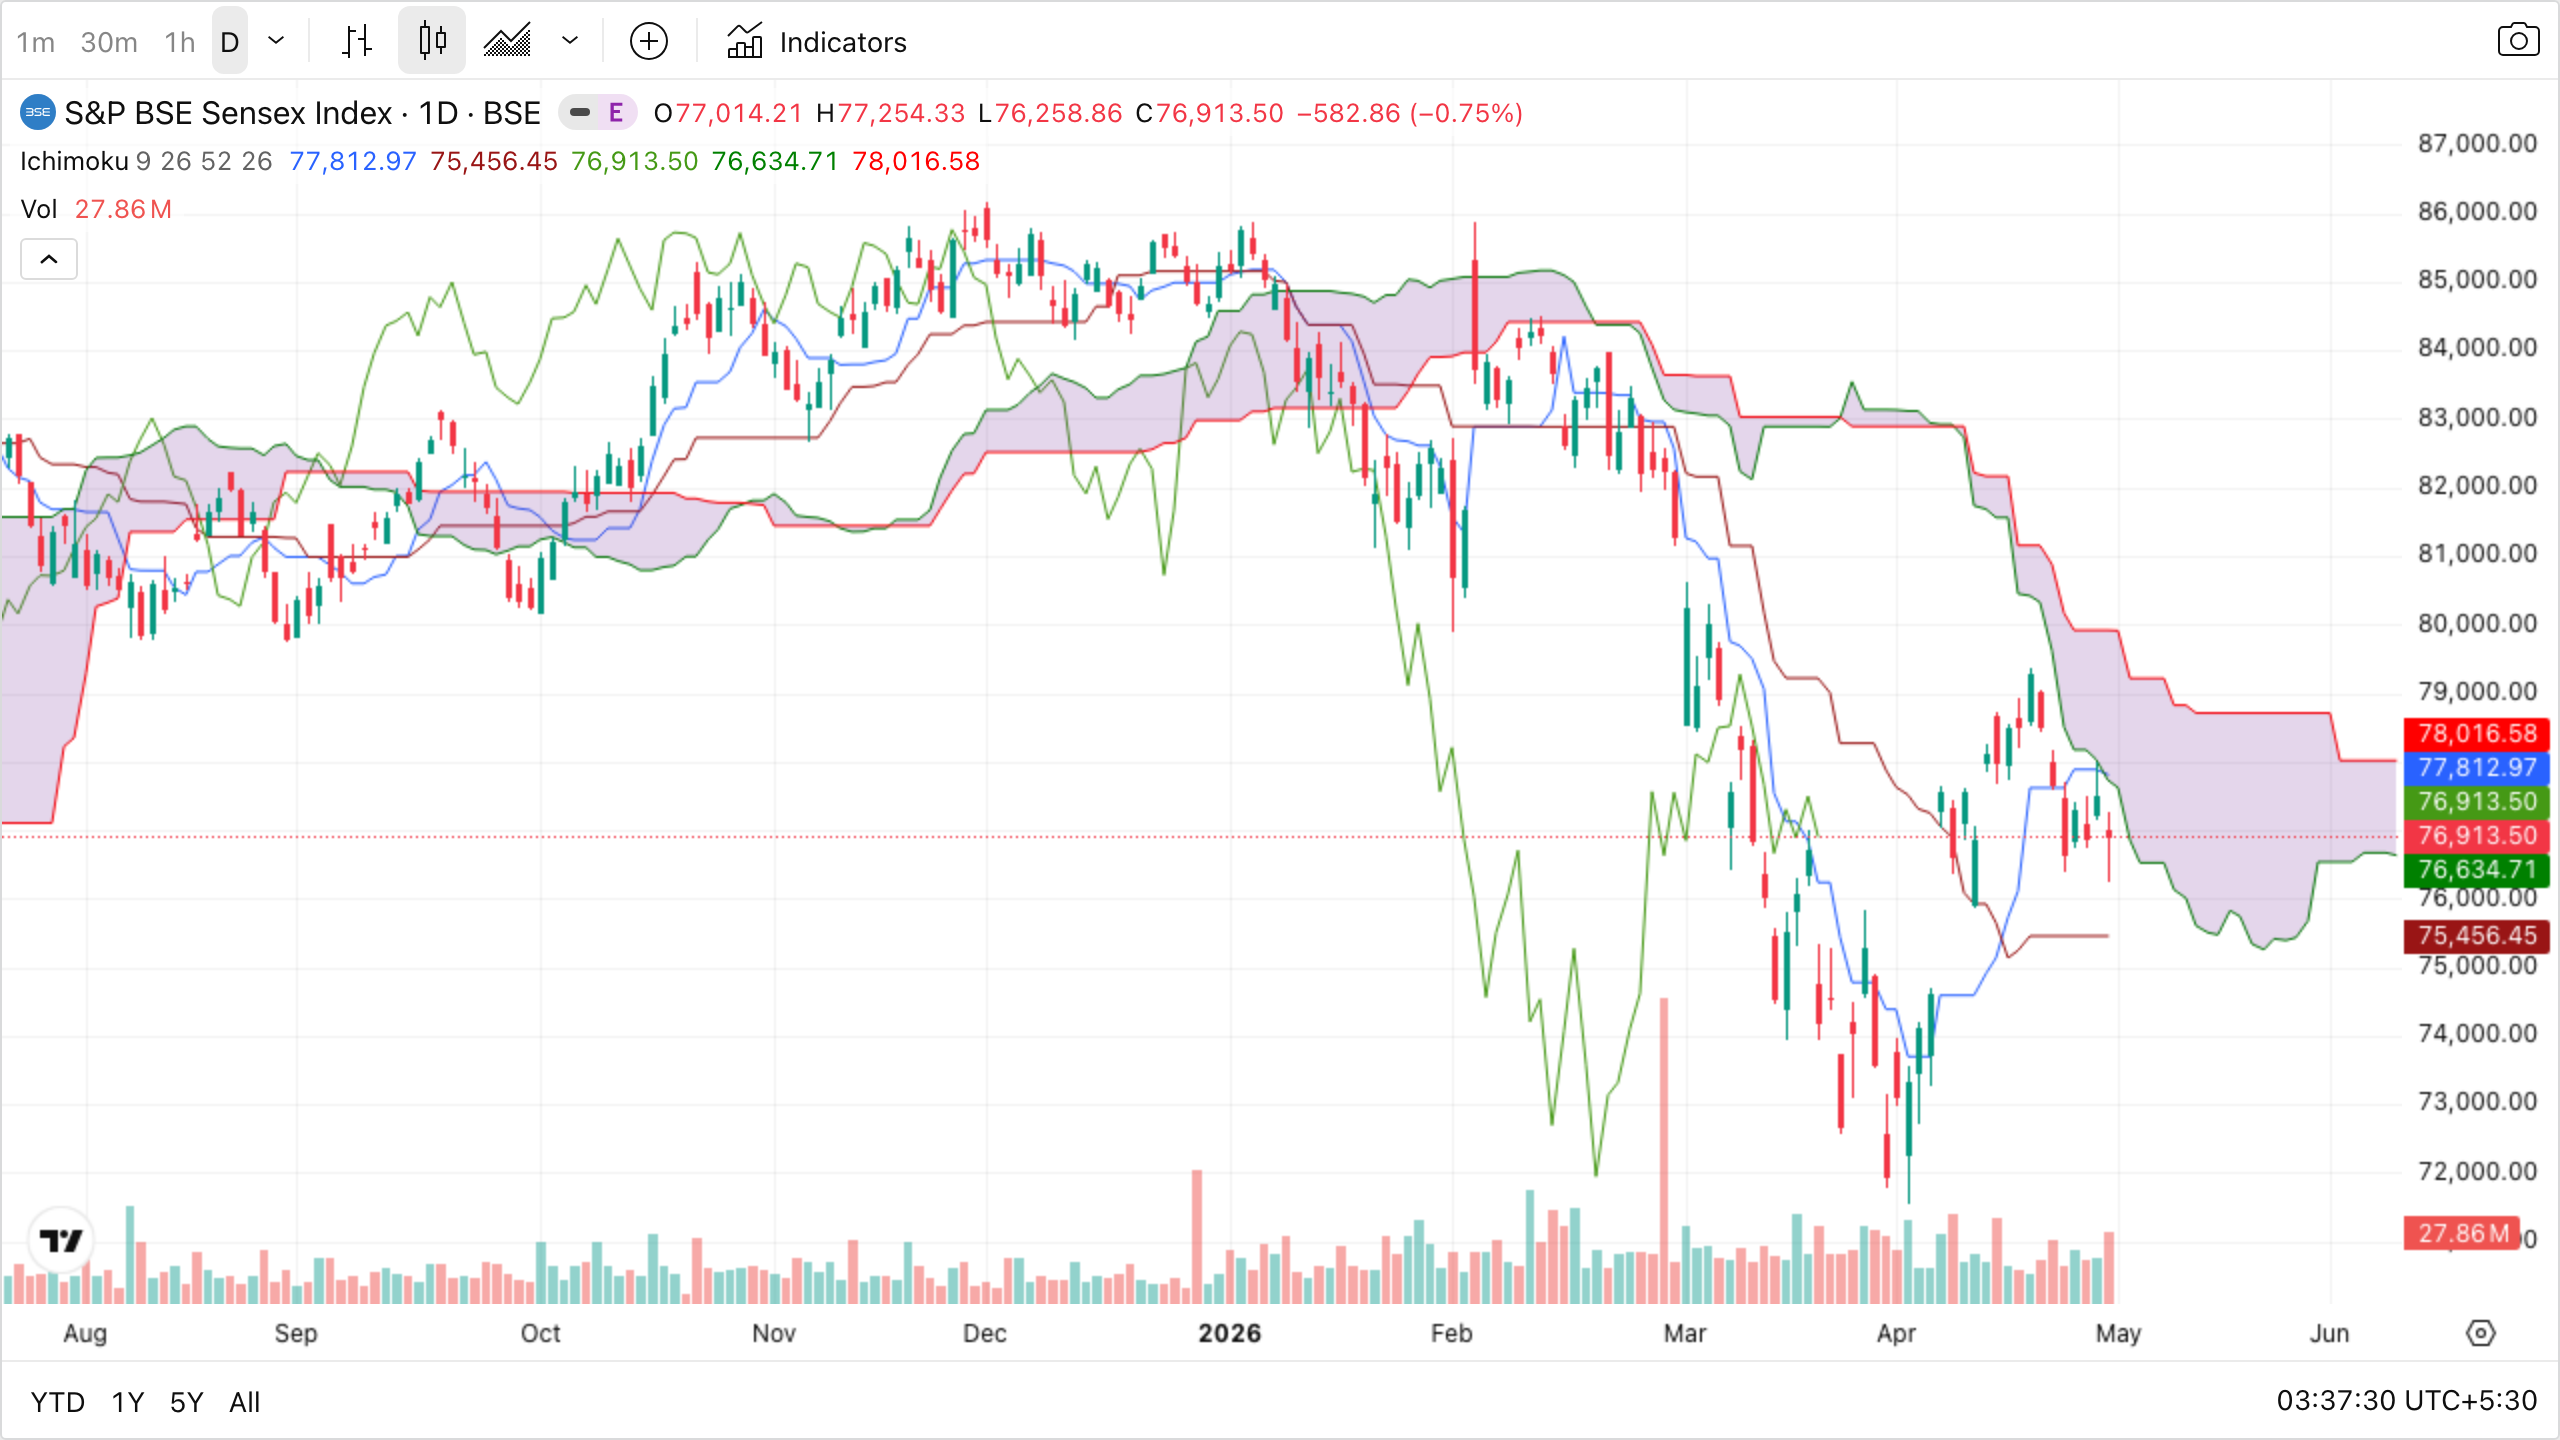
Five things drawn at once — it looks busy at first but each line has a job. The shaded “cloud” (Kumo) is the heavy visual: when price is above it, the regime is bullish; below it, bearish; inside it, no-trade chop. The thickness of the cloud at any point tells you how much support/resistance lies there — a fat cloud is hard to break, a thin one is easy.
Layered on top are two thin lines (Tenkan = fast average, Kijun = slower baseline). Their crossover while price is above the cloud is a strong long trigger; crossover while below is a strong short trigger. The fifth component (Chikou, the lagging line) checks whether current price is above the price from 26 bars ago — a final “yes the trend is real” stamp.
Using all five takes practice, but even a beginner can extract value from just the cloud: only trade longs when price is comfortably above it; only trade shorts when below. That single filter alone removes a huge category of bad-context trades.
Best on daily and higher TFs. Avoid on intraday (too noisy).
Volume Profile
Histogram of volume traded at each price (vertical, on the right side of the chart). Different from time-based volume bars.
Key terms:
- POC (Point of Control) — price with the highest volume. Strongest magnet / S/R.
- VAH / VAL (Value Area High / Low) — boundaries of where 70% of volume traded.
- HVN (High-Volume Node) — thick area, acts as support/resistance.
- LVN (Low-Volume Node) — thin area, price moves through quickly.
Trading uses
- Acceptance vs rejection: Price entering an HVN tends to consolidate; entering an LVN often shoots through.
- Mean-reversion: Price away from POC tends to revert.
- Breakouts: A move out of value area, with rising volume, often runs to the next HVN.
Available in TradingView (paid) and most pro platforms.
Market Profile (TPO)
Cousin of Volume Profile, but tracks time at price (Time Price Opportunity letters per 30-min bracket). Auction-theory based.
- Initial Balance (IB) = first 1 hour’s range. Often defines the day.
- Day types: Trend day, normal day, neutral day, double distribution.
Heavier learning curve; powerful for futures intraday traders.
RVOL — Relative Volume
- RVOL > 2 → unusual interest. Worth investigating.
- RVOL < 0.5 → dead stock, avoid.
Key filter in any momentum/breakout scan. A breakout on RVOL 1.0 is suspect; on RVOL 3.0+ it’s real.
Anchored VWAP (AVWAP)
Standard VWAP resets daily. Anchored VWAP starts from a chosen bar (an event, swing high/low, earnings day) and runs continuously.
Why it matters
- AVWAP from a major earnings beat = the average price every buyer since that event has paid. Acts as a strong S/R.
- AVWAP from the all-time high = institutional pain point.
- AVWAP from the 52-week low = the trend’s “fair value.”
How to use
- Long pullbacks to AVWAP in an uptrend.
- Short rejections at AVWAP in a downtrend.
- Reclaim/loss of AVWAP = regime change.
Brian Shannon popularized this. Works very well with MTFA.
ADR / ATR% — for normalizing volatility
- ADR (Average Daily Range) = avg (high − low) over N days.
- ATR% = ATR / price × 100.
Lets you compare a ₹100 stock and a ₹3,000 stock on the same scale. Crucial for screening — a stock with ATR% < 2 won’t move enough for intraday.
CPR — Central Pivot Range
Three lines drawn at start of day from prior day’s HLC:
- Pivot = (H + L + C) / 3
- BC = (H + L) / 2
- TC = 2 × Pivot − BC
The CPR width predicts the day type:
- Narrow CPR → trending day expected.
- Wide CPR → range/consolidation day.
Combined with prior-day high/low, gives clean intraday roadmaps. Popular with Indian intraday traders.
Donchian Channels
Highest high and lowest low of last N periods. The classic breakout indicator (Turtle Traders used 20-day Donchian).
- Long when price breaks above 20-day high.
- Exit when price breaks below 10-day low.
Simple, robust, and the base of many trend-following systems.
Renko / Heikin-Ashi for trend filtering
Not standalone strategies, but noise filters:
- Renko bricks — only print when price moves a fixed amount; ignore time. Clean trends.
- Heikin-Ashi candles — averaged candles; long green sequences signal strong trends.
Use for trend confirmation, not entry timing (they lag real price).
Building a layered system
A sound advanced setup uses indicators from non-overlapping families:
Trend regime:       Ichimoku cloud (daily)
Momentum filter:    RSI > 50 or MACD histogram positive
Volatility filter:  ATR% > 2.5
Volume confirmation: RVOL > 1.5
Entry trigger:      Break of 1h high above AVWAP
SL placement:       2 × ATR or below recent swing
Each indicator earns its place by adding non-redundant information. Adding 3 momentum oscillators is just one signal in a trench coat.