vol. 02 · tier 02 // ch. 04 of 10 · intermediate course
Option Greeks
Greeks measure how an option's premium responds to changes in price, time, and volatility. You cannot trade options seriously without understanding them.
- read
- ~7 min
- length
- 1,283 words
- position
- 04 of 10
4. Option Greeks
Greeks measure how an option’s premium responds to changes in price, time, and volatility. You cannot trade options seriously without understanding them.
The five greeks
| Greek | Symbol | Measures sensitivity to |
|---|---|---|
| Delta | Δ | Change in underlying price |
| Gamma | Γ | Change in delta |
| Theta | Θ | Passage of time |
| Vega | ν | Change in implied volatility |
| Rho | ρ | Change in interest rates (mostly negligible) |
Delta (Δ)
How much the option premium changes for a ₹1 move in the underlying.
| Option | Delta range |
|---|---|
| Deep ITM Call | +0.80 to +1.00 |
| ATM Call | ~+0.50 |
| OTM Call | 0 to +0.30 |
| Deep ITM Put | −0.80 to −1.00 |
| ATM Put | ~−0.50 |
| OTM Put | 0 to −0.30 |
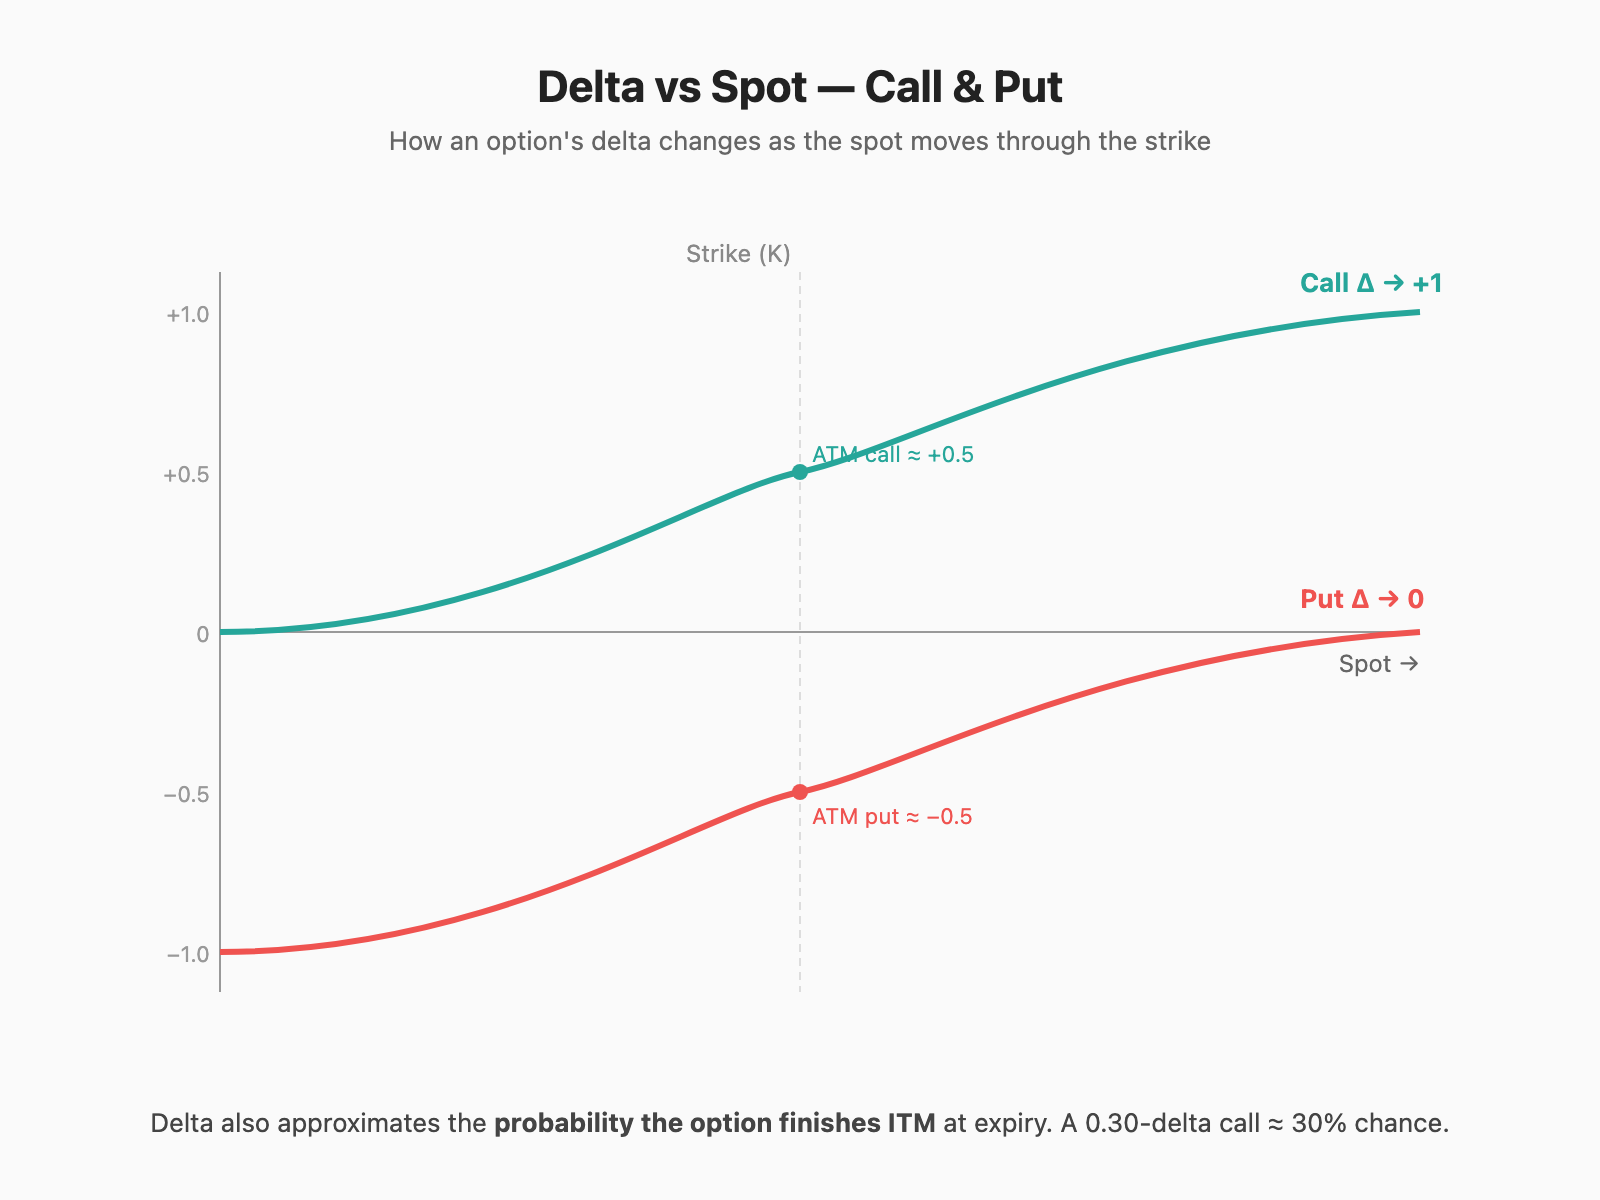
Two S-shaped curves — the green one is a call’s delta, the red one is a put’s delta, both plotted as spot price slides through the strike (vertical dashed line at K).
Far to the left of the strike (spot well below): the call is deep OTM — a ₹1 move in spot barely budges the premium, so call delta is near 0. The put is deep ITM and behaves almost like a short stock position — its delta is near −1.
Far to the right (spot well above strike): roles invert. Call delta climbs toward +1 (it now moves rupee-for-rupee like the underlying), put delta drifts to 0.
Right at the strike (the marked dots): both options sit at delta ±0.5, splitting the difference — hence “50-delta” being the standard ATM proxy. Notice the curves are steepest at the strike too — that steepness is gamma, the rate of change of delta. ATM near expiry = maximum gamma = wildest delta swings.
Practical use
- Delta ≈ probability of finishing ITM. A 0.30-delta call has roughly a 30% chance of being ITM at expiry.
- Equivalent share exposure. Long 1 lot Nifty 24500 CE (delta 0.50) ≈ holding 12.5 Nifty (25 × 0.50).
- Hedging. A portfolio with +Δ 200 can be neutralized by selling options/futures with −Δ 200 (“delta-neutral”).
Example
You own Nifty 24500 CE @ ₹150, delta 0.50. Nifty rises 100 points (24,500 → 24,600).
- Approx new premium = 150 + (100 × 0.50) = ₹200.
Gamma (Γ)
Rate of change of delta. Highest for ATM options near expiry.
- High gamma → delta changes fast → premium swings wildly with small price moves.
- Long options = positive gamma (good for buyers in big moves).
- Short options = negative gamma (sellers’ nightmare in trending markets).
“Gamma squeeze” — if many traders are short ATM calls and price runs up, their delta exposure explodes, forcing them to buy → fueling the move further.
Theta (Θ)
Time decay. The premium an option loses per day, all else equal.
- Theta is always negative for buyers, positive for sellers.
- Accelerates in the last 2 weeks before expiry — especially for ATM options.
Example
A weekly ATM Nifty option might have theta = −15. Hold it overnight → lose ₹15 × 25 = ₹375 per lot even if the market doesn’t move.
Why option sellers love theta: they get paid to wait. Even sideways markets are profitable. Why option buyers hate theta: the clock is always ticking against you.
Theta and DTE (Days To Expiry)
Theta decay (% of premium per day)
    |
20% |                              .
    |                          .
10% |                     .
    |              .
 5% | .  .  .
    |________________________________
     30  20  10   5   3   1   0   DTE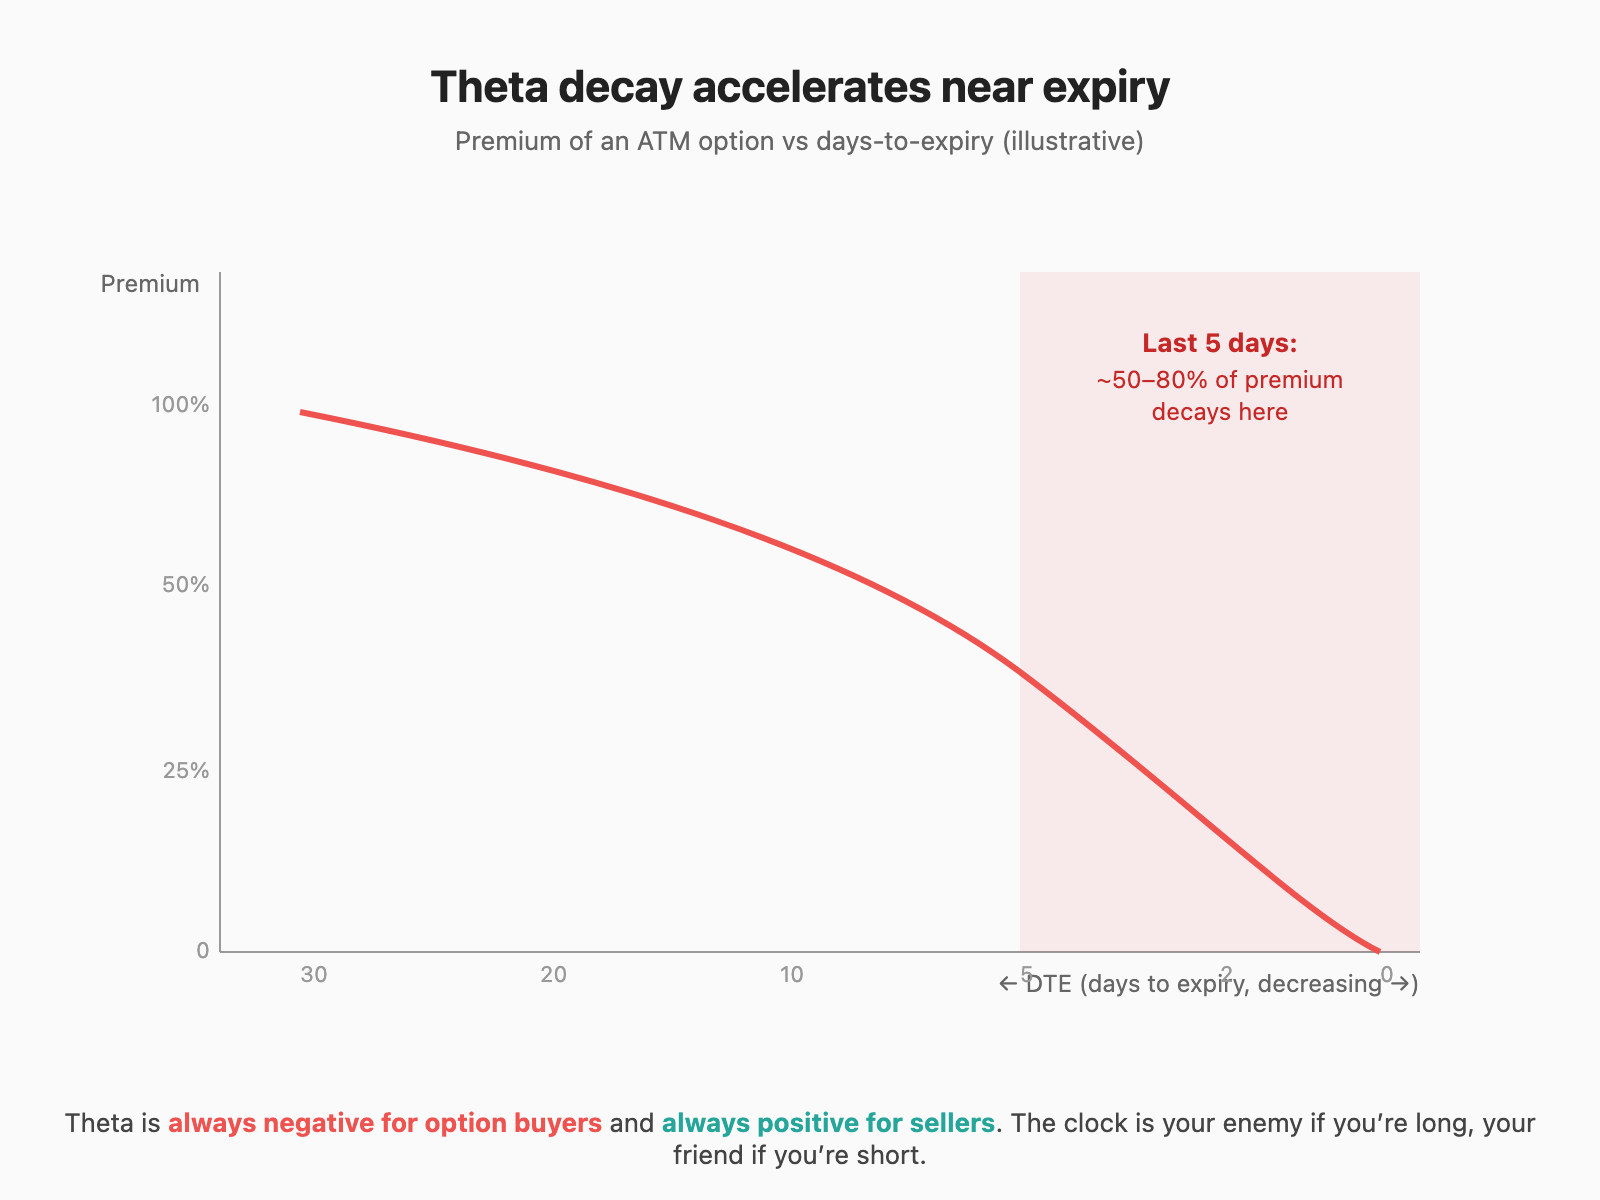
The red curve plots an ATM option’s premium against days-to-expiry, with DTE decreasing left to right (so time flows left to right, just like trading days). For the first three weeks (the gentle slope on the left) decay is slow and almost linear — you’d barely notice losing it. Then as you enter the shaded red zone in the last 5 days, the curve plunges off a cliff: the option dumps roughly half of its remaining premium in the final week, and a meaningful chunk of that in the final 24 hours.
This is why “sell options on Wednesday or Thursday morning to harvest expiry decay” is a real strategy — you’re standing on the edge of the cliff as a seller, with the cliff working for you. It’s also why “buy a cheap weekly OTM and pray” is such a reliable way to lose money: you stand at the cliff edge as a buyer, and time itself is racing your account to zero.
ATM weekly options can lose 30–50% of premium in the last 24 hours. This is why selling weekly options on Thursday morning is a popular (but risky) strategy.
Vega (ν)
Change in premium per 1% change in IV.
- Long options = positive vega.
- Short options = negative vega.
- Higher for longer-dated and ATM options.
Why it matters
Suppose RBI policy is tomorrow. Nifty IV is at 18% and you buy an ATM call at ₹200 (vega = 25).
After the announcement, IV crashes to 12% (no shock).
- Vega impact: −6 × 25 = −₹150 per share.
- Even if Nifty moved 0.5% in your favor (delta gain ~₹62), you net −₹88.
This is IV crush, the silent killer of event-driven option buying.
Rho (ρ)
Sensitivity to interest rates. In India, with rates moving slowly, mostly ignored for retail trades.
Putting greeks together — a 3-leg checklist before entering an option trade
- Direction (Delta): Does the option’s delta match my view’s magnitude and probability?
- Time (Theta): Do I have enough days for my thesis to play out before decay eats me?
- Volatility (Vega): Am I buying when IV is low (cheap) or high (expensive)? Is there a known event that will crush IV?
If you can’t answer all three, don’t take the trade.
Greek profiles — common strategies
| Strategy | Δ | Γ | Θ | ν |
|---|---|---|---|---|
| Long Call | + | + | − | + |
| Long Put | − | + | − | + |
| Short Call | − | − | + | − |
| Short Put | + | − | + | − |
| Long Straddle | 0 | + | − − | + + |
| Short Straddle | 0 | − | + + | − − |
| Iron Condor (short) | ~0 | − | + | − |
Tools
- Sensibull (sensibull.com) — best Indian options analytics, free greeks visualization, payoff diagrams.
- Opstra (opstra.definedge.com) — advanced strategy builder, IV percentile charts.
- NSE option chain — has IV per strike for free.
Quick rules of thumb
- Buy options only when IV is in the bottom 30% of its 1-year range, with a strong directional thesis and ≥ 30 DTE.
- Sell options when IV is in the top 30%, with defined risk (spreads, not naked).
- Avoid trading options in the last 2 days of weekly expiry unless you specialize in expiry plays — gamma is wild.
- Never short naked options without a hedge. One overnight gap can erase a year of gains.